Initializing the Dashboard
When a user navigates to the Deliveries page, the app immediately establishes a secure connection to the Sasini backend.The Steaming Cup (Loading State)
Because data is never stored statically on the device, the app initiates an API call upon page load. While fetching, the user is presented with our signature Steaming Cup Loading Indicator—a beautiful, dynamic animation symbolizing our core commodities: Tea and Coffee.
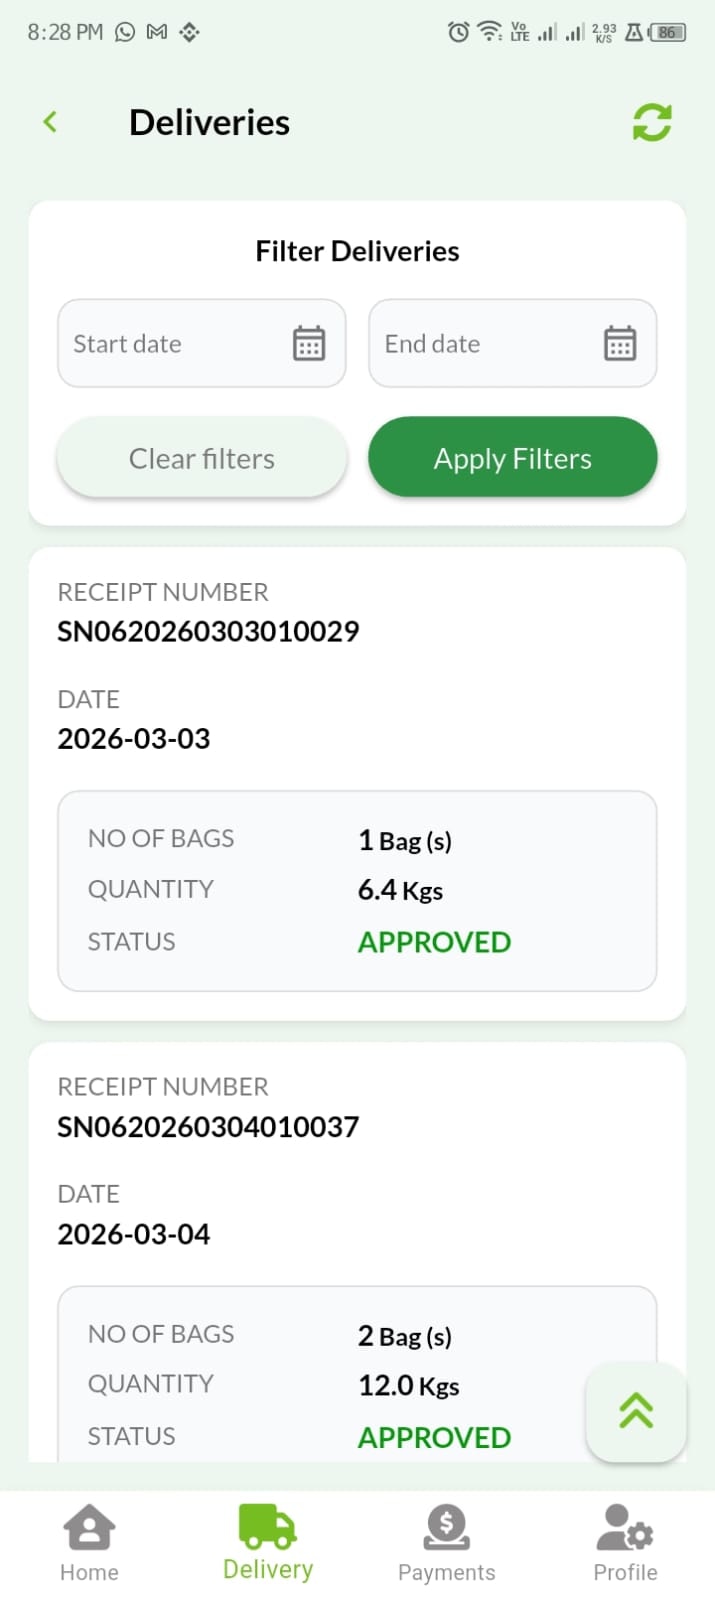
Network Resilience (The Refresh Button): If the API takes too long to respond due to server cold-starts or poor network connectivity, a Refresh 🔄 button becomes active. Tapping this manually re-triggers the data request without requiring the user to leave the page. It is located at the top right of the screen.
Interactive Daily Breakdowns
We believe in absolute transparency. The initial view provides a macro-summary of each day, but users can dig deeper.Granular Bag Breakdowns
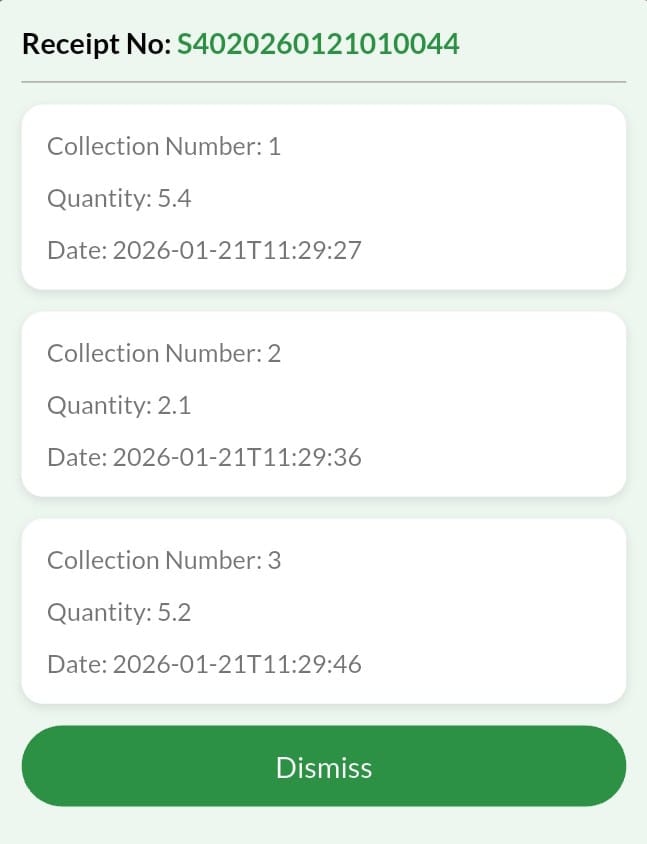
The Tap Interaction: By tapping on any specific daily delivery card, a detailed breakdown modal slides up.If a farmer delivered 20 bags on Tuesday, the breakdown will explicitly detail:
- The exact time each individual bag was weighed.
- The exact kilogram weight of every single bag.
- The receipt number containing all the bags.
Advanced Time Filtering & AI Summaries
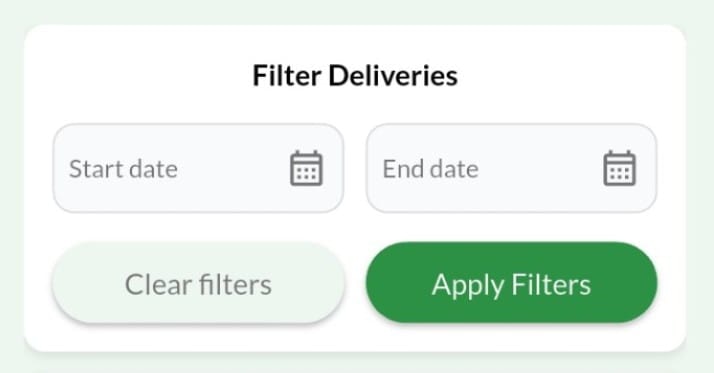
Farmers are not restricted to the current month; they can traverse their entire historical database using the robust filtering engine.Date Range Filtering 📊
Users can select a customStart Date and End Date.
- Manual Execution: The data does not auto-refresh. The user must explicitly tap the “Filter” button to execute the new API call, saving their mobile data bandwidth.
- Reset Function: A quick “Reset Filters” button instantly returns the view to the current month.

Empty States (No Records Found): If the API returns a
200 OK status but the data array is empty (meaning the farmer made zero deliveries in that selected timeframe), the app gracefully handles the null response. Instead of a blank screen or an error, it displays a friendly “No Records Found” illustration, preventing user confusion.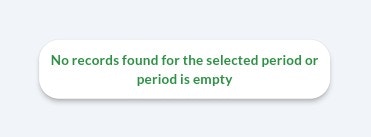
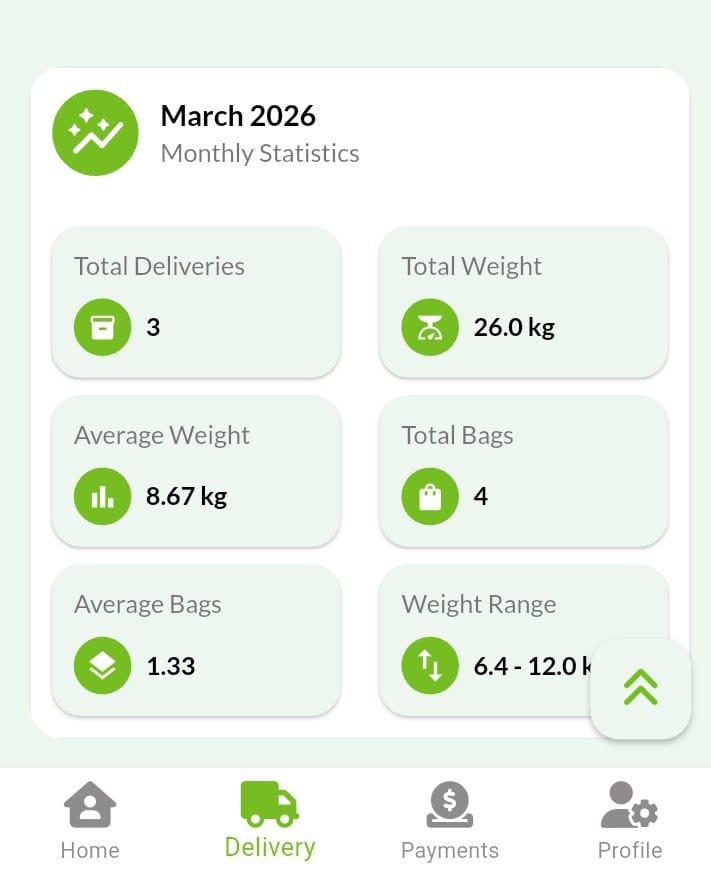
AI Auto-Summary Statistics ✨
Once a date range is loaded, the integrated Sasini AI instantly analyzes the dataset and generates a top-level statistics card. Metrics Calculated:- 📦 Total Deliveries Count
- 🧺 Total Bags Delivered
- ⚖️ Total Cumulative Weight (Kgs)
- 📊 Average Weight per Bag
- 📈 Daily Average Delivery
- 🎯 Range of Kgs (Highest vs. Lowest performing days)
Quality of Life Features